K using zoom – Casio FX-CG10 Manuel d'utilisation
Page 587
20100801
20100801
ε
-41
Graph Analysis Tool Graph Screen Operations
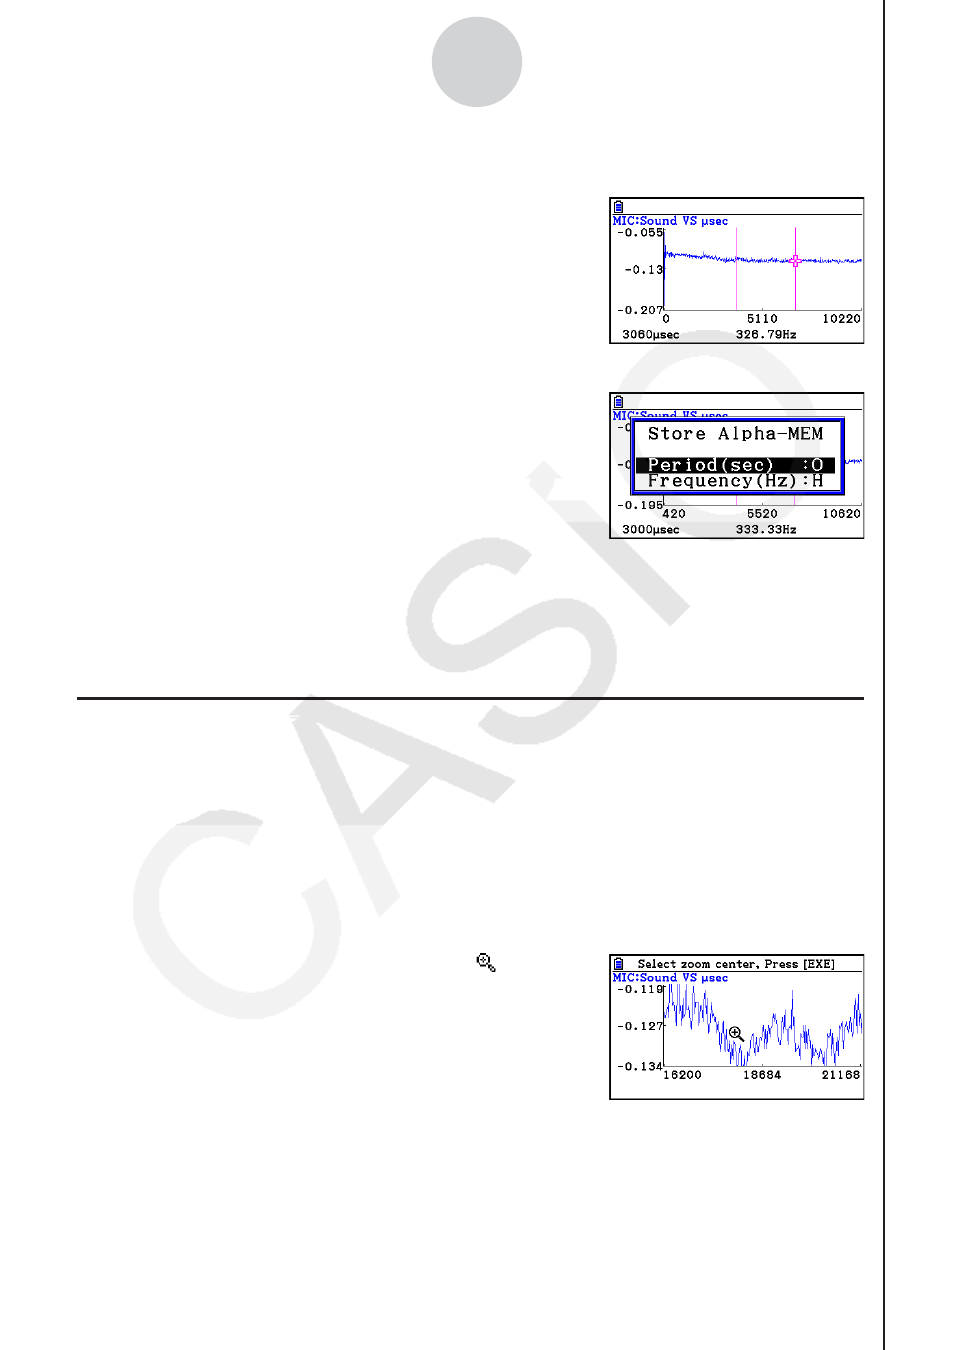
3. Move the trace pointer to the end point of the range whose periodic frequency you want
to obtain.
• This causes the period and periodic frequency value
at the start point you selected in step 2 to appear
along the bottom of the screen.
4. Press
w to assign the period and periodic frequency values to Alpha memory variables.
• This displays a dialog box for specifying variable
names for [Period] and [Frequency] values.
• The initial default variable name settings are “S” for
the period and “H” for the periodic frequency. To
change to another variable name, use the up and
down cursor keys to move the highlighting to the item
you want to change, and then press the applicable
letter key.
5. After everything is the way you want, press
w.
• This stores the values and exits the trace operation.
• For details about using Alpha memory, see Chapter 2 of this manual.
k Using Zoom
Zoom lets you enlarge or reduce the size of the graph along the
x
-axis or the
y
-axis.
Note
• When there are multiple graphs on the screen, the procedure below zooms all of them.
For information about zooming a particular graph when there are multiple graphs on the
screen, see “Working with Multiple Graphs” on page
ε
-46.
• To zoom the graph screen
1. On the graph screen, press
!2(ZOOM).
• This causes a magnifying glass cursor (
) to appear
in the center of the screen.
2. Use the cursor keys to move the magnifying glass cursor to the location on the screen
that you want at the center of the enlarged or reduced screen.