Casio FX-CG10 Manuel d'utilisation
Page 583
20100801
20100801
ε
-37
Using the Graph Analysis Tools to Graph Data
3. Press
2(DATA).
• This displays the Sampling Data List screen.
4. Specify the sampled data for graphing.
a. Use the
f and c cursor keys to move the highlighting to the name of the sampled
data file you want to select, and then press
1(ASSIGN) or w.
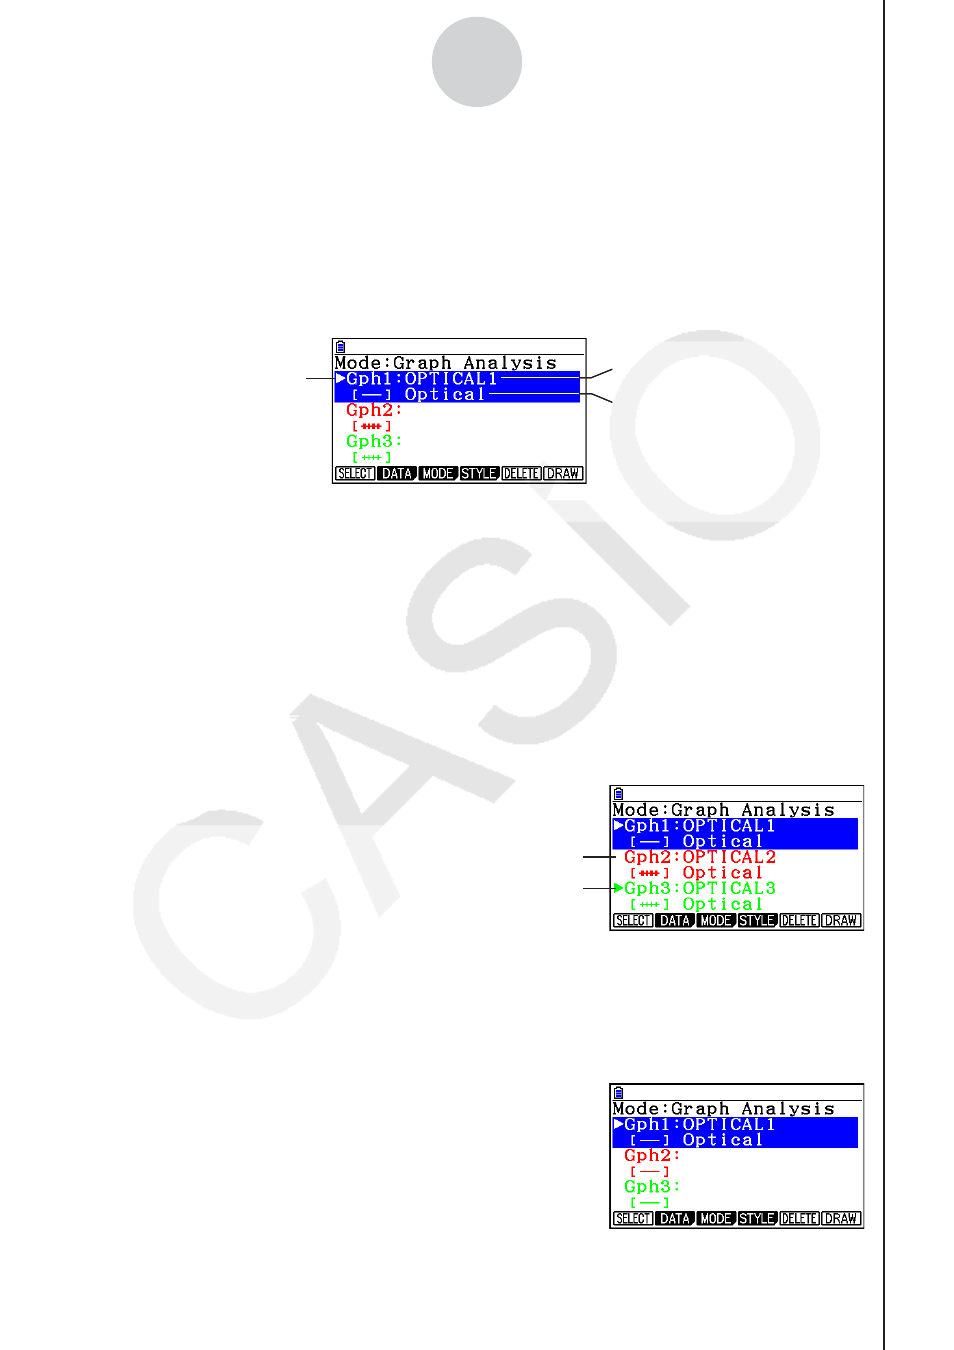
• This returns to the Graph Mode screen, which shows the name of the sample data file
you selected.
Graph on/off indicator
Sample data file name
Name of sensor used for sampling
Graph Mode Screen
b. Repeat step a above to specify sample data files for other graphs, if there are any.
• If you select “Graph Analysis” as the analysis mode in step 2, you must specify
sample data files for three graphs. If you select “Compare Graph” as the analysis
mode in step 2, you must specify sample data files for two graphs. With other modes,
you need to specify only one sample data file.
• For details about Sampling Data List screen operations, see “Using Sample Data
Memory” (page
ε
-33).
5. Turn on graphing for each of the graphs listed on the Graph Mode screen.
a. On the Graph Mode screen, use the
f and c cursor keys to select a graph, and
then press
1(SELECT) to toggle graphing on or off.
Graphing turned off.
Graphing turned on.
b. Repeat step a to turn each of the graphs listed on the Graph Mode screen on or off.
6. Select the graph style you want to use.
a. On the Graph Mode screen, use the
f and c cursor keys to move the highlighting
to the graph (Gph1, Gph2, etc.) whose style you want to specify, and then press
4(STYLE). This will cause the function menu to change as shown below.