Casio fx-9860G Slim Manuel d'utilisation
Page 211
Advertising
20070201
5-6-2
Représentation graphique manuelle
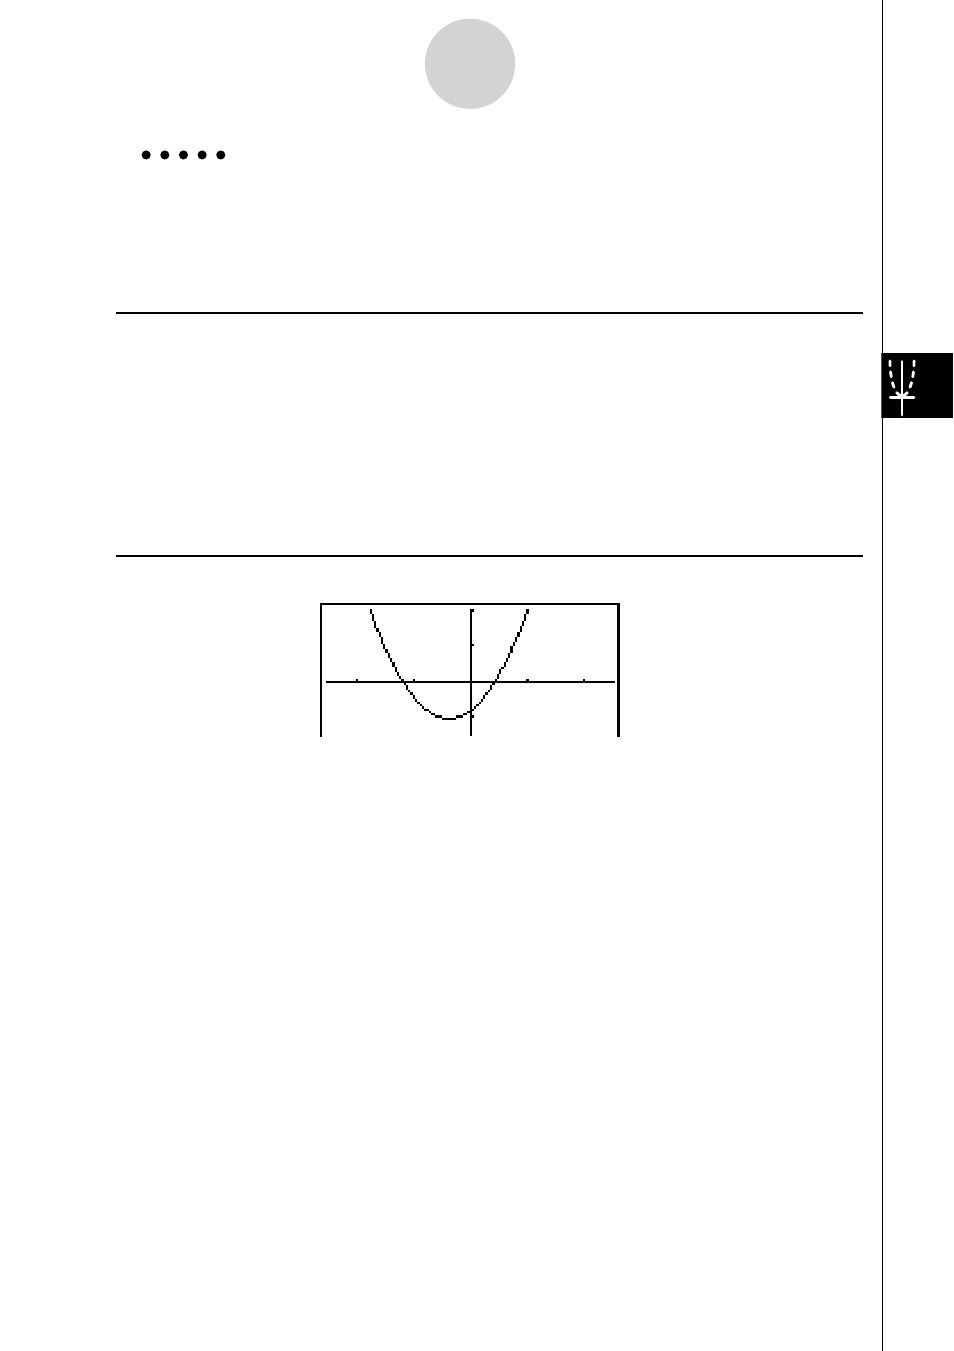
Exemple Représentez
graphiquement
y
= 2
x
2
+ 3
x
– 4
Utilisez les réglages de fenêtre d’affi chage suivants.
Xmin = –5,
Xmax = 5,
Xscale = 2
Ymin = –10,
Ymax = 10,
Yscale = 5
Procédure
1
m RUN
•
MAT
2
!3(V-WIN) -fwfwcwc
-bawbawfwJ
3
!4(SKTCH)1(Cls)w
5(GRPH)1(Y=)
4 c
vx+dv-ew
Ecran de résultat
Advertising
Voir aussi d'autres documents dans la catégorie Calculatrices Casio:
- FX-9750GII (Pages: 17)
- FX-9750GII (Pages: 416)
- FX-300MS (Pages: 2)
- FX-991ES (Pages: 77)
- fx-9860G SD (Pages: 596)
- FX-CG20 (Pages: 18)
- FX-CG20 (Pages: 602)
- fx-300ES (Pages: 54)
- fx-115MS (Pages: 40)
- FX-82SOLAR (Pages: 40)
- fx-570ES PLUS (Pages: 48)
- fx-300W (Pages: 37)
- TE-100 (Pages: 88)
- fx-270MS (Pages: 41)
- SF-4900ER (Pages: 124)
- fx-95MS (Pages: 2)
- SF-7200SY (Pages: 93)
- FX-85ES PLUS (Pages: 36)
- ClassPad 300 (Pages: 670)
- fx-570W (Pages: 44)
- fx-570ES (Pages: 75)
- ClassPad 300 PLUS (Pages: 753)
- FC-100V (Pages: 150)
- fx-250HC (Pages: 36)
- KL-750 (Pages: 20)
- fx-500ES (Pages: 55)
- fx-9860G Slim (Pages: 19)
- ClassPad 330 V.3.06 (Pages: 46)
- ClassPad 330 PLUS (Pages: 64)
- ClassPad 330 PLUS (Pages: 923)
- ClassPad fx-CP400 Exemples (Pages: 43)
- ClassPad fx-CP400 (Pages: 286)
- ClassPad 330 V.3.03 (Pages: 944)
- ClassPad 330 V.3.04 (Pages: 957)
- ClassPad 300 PLUS Application de mise à jour du système d'exploitation (Pages: 14)
- CFX-9850GB PLUS Chapitre 1 (Pages: 22)
- CFX-9850GB PLUS Chapitre 2 (Pages: 18)
- CFX-9850GB PLUS Chapitre 3 (Pages: 14)
- CFX-9850GB PLUS Chapitre 4 (Pages: 6)
- CFX-9850GB PLUS Chapitre 5 (Pages: 6)
- CFX-9850GB PLUS Chapitre 6 (Pages: 20)
- CFX-9850GB PLUS Chapitre 7 (Pages: 12)
- CFX-9850GB PLUS Chapitre 8 (Pages: 32)
- CFX-9850GB PLUS Chapitre 9 (Pages: 10)