Chapitre 12 : application programme – Casio ClassPad fx-CP400 Exemples Manuel d'utilisation
Page 39
Chapitre 12 : Application Programme 39
Chapitre 12 :
Application Programme
Remarque :
La notation dans le « Program » utilise
Ⅺ pour représenter un espace et _ pour un retour à la
ligne.
1201
Programme :
DefaultSetup
_
ClrGraph
_
ViewWindow
_
SetInequalityPlot
Ⅺ
Intersection
_
GraphType
Ⅺ"y>"_
Define
Ⅺy1(x)=sin(x)_
GTSelOn
Ⅺ1_
PTDot
Ⅺ1_
SheetActive
Ⅺ1_
DrawGraph
_
GraphType
Ⅺ"y<"_
Define
Ⅺy2(x)=−x/12_
GTSelOn
Ⅺ2_
PTNormal
Ⅺ2_
SheetActive
Ⅺ1_
DrawGraph
Écran de résultat :
1202
Programme :
ClrGraph
_
ViewWindow
Ⅺ–15.4,15.4,2,–7.6,
7.6,2
_
"(x–1)^2/3^2+(y–2)^2/4^2= 1"
SConicsEq_
DrawConics
Écran de résultat :
1203
Programme :
DefaultSetup
_
ClrGraph
_
ViewWindow
Ⅺ0,7.7,1,–14,110,
10
_
GraphType
Ⅺ"y="_
Define
Ⅺy1(x)=3×x^2–2_
GTSelOn
Ⅺ1_
0
SFStart_
6
SFEnd_
1
SFStep_
SheetActive
Ⅺ1_
DispFTable
_
Pause
_
DrawFTGCon
Écran de résultat :
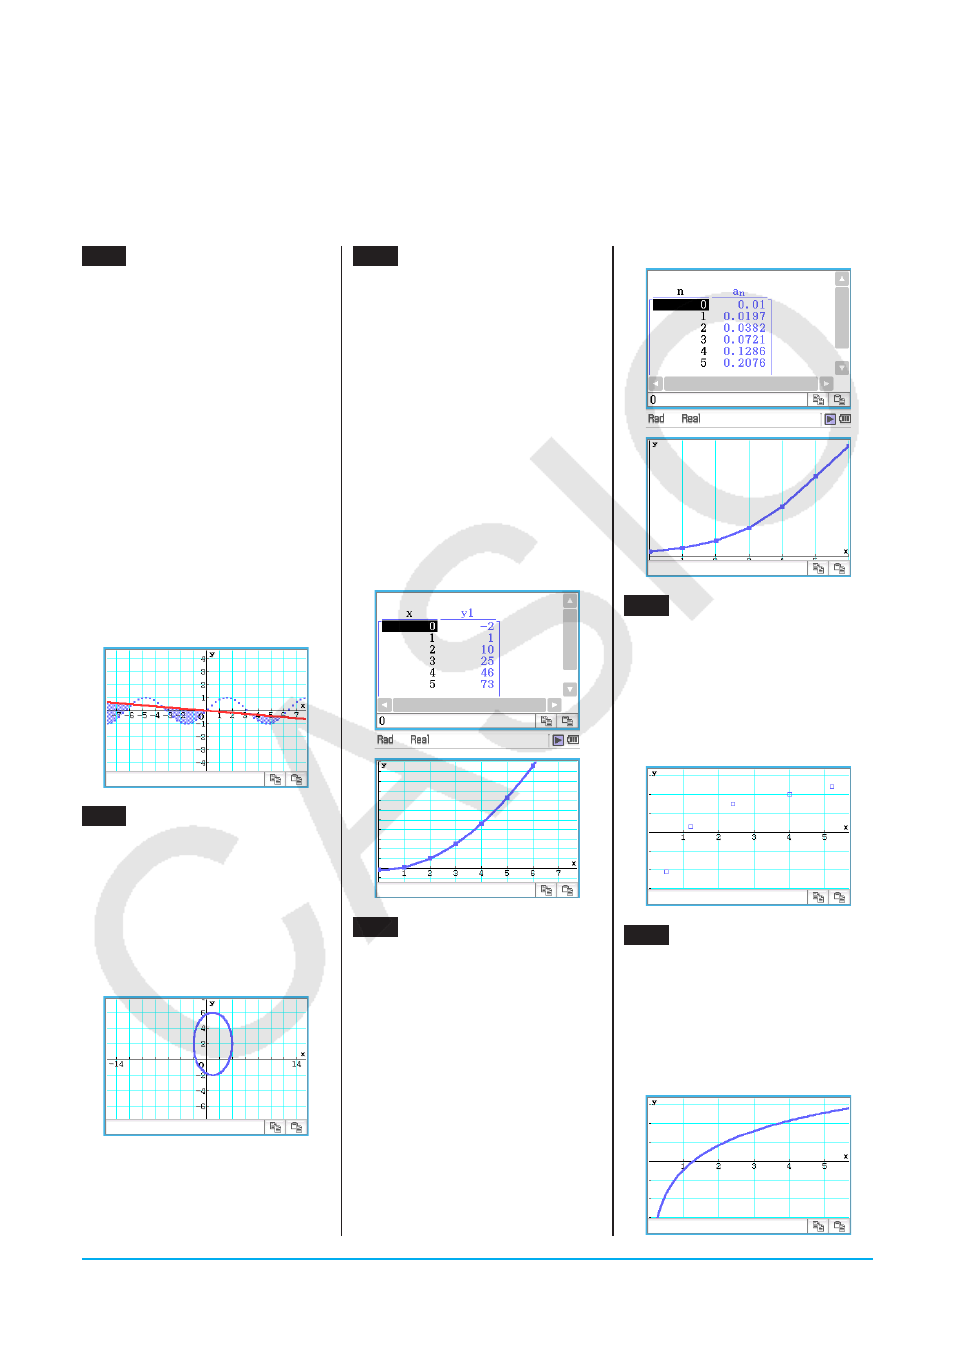
1204
Programme :
DefaultSetup
_
ViewWindow
Ⅺ0,6,1,−0.01,0.3,1_
SeqType "a
n+1
a
0
"
_
"−3a
n
^2+2a
n
"
Sa
n+1
_
0
SSqStart_
6
SSqEnd_
0.01
Sa
0
_
DispSeqTbl
_
Pause
_
DrawSeqCon
Écran de résultat :
1205
Programme :
{0.5,1.2,2.4,4,5.2}
Slist1_
{–2.1,0.3,1.5,2,2.4}
Slist2_
StatGraph
Ⅺ1, On, Scatter, list1,
list2, 1, Square
_
DrawStat
Écran de résultat :
1206
Programme :
{0.5,1.2,2.4,4,5.2}
Slist1_
{–2.1,0.3,1.5,2,2.4}
Slist2_
StatGraph
Ⅺ1, On, LogR, list1,
list2, 1
_
DrawStat
Écran de résultat :