Casio GRAPH 85 Manuel d'utilisation
Page 209
Advertising
20050301
5-6-4
Représentation graphique manuelle
○ ○ ○ ○ ○
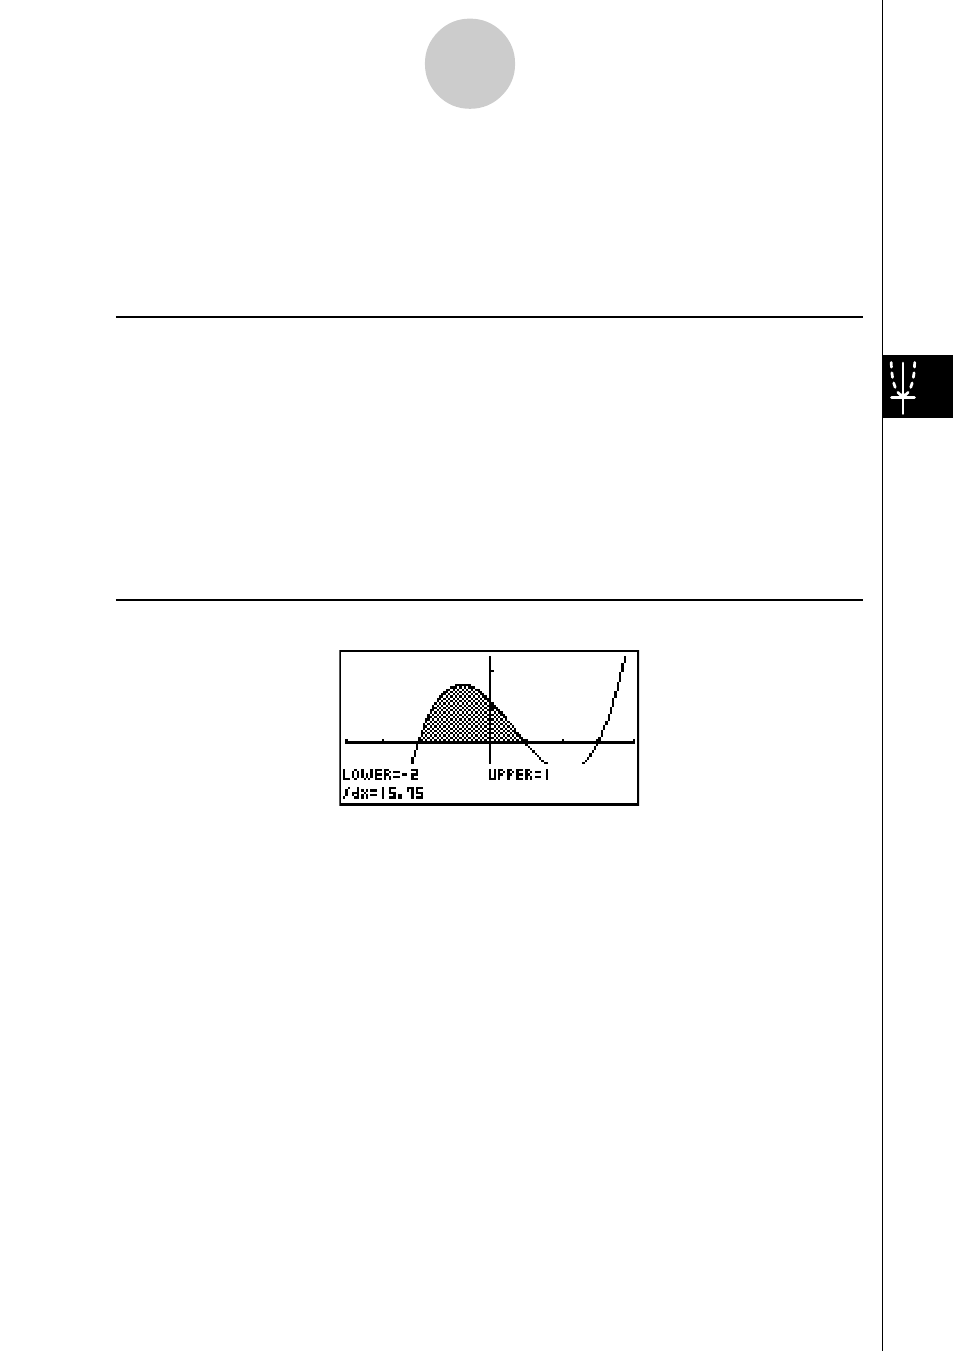
Exemple
Tracez le graphe pour l’intégrale
∫
(
x
+ 2)(
x
– 1)(
x
– 3) dx.
Utilisez les réglages de fenêtre d’affichage suivants.
Xmin = – 4,
Xmax = 4,
Xscale = 1
Ymin = –8,
Ymax = 12,
Yscale = 5
Procédure
1
m RUN
•
MAT
2
!3(V-WIN) -ewewbwc
-iwbcwfwJ
3
!4(SKTCH)1(Cls)w
5(GRPH)5(G
•
∫ dx)
4 (
v+c)(v-b)(v-d),
-c,bw
Ecran de résultat
1
–2
Advertising
Ce manuel est liée aux produits suivants: