Casio GRAPH 85 Manuel d'utilisation
Page 207
Advertising
20050301
5-6-2
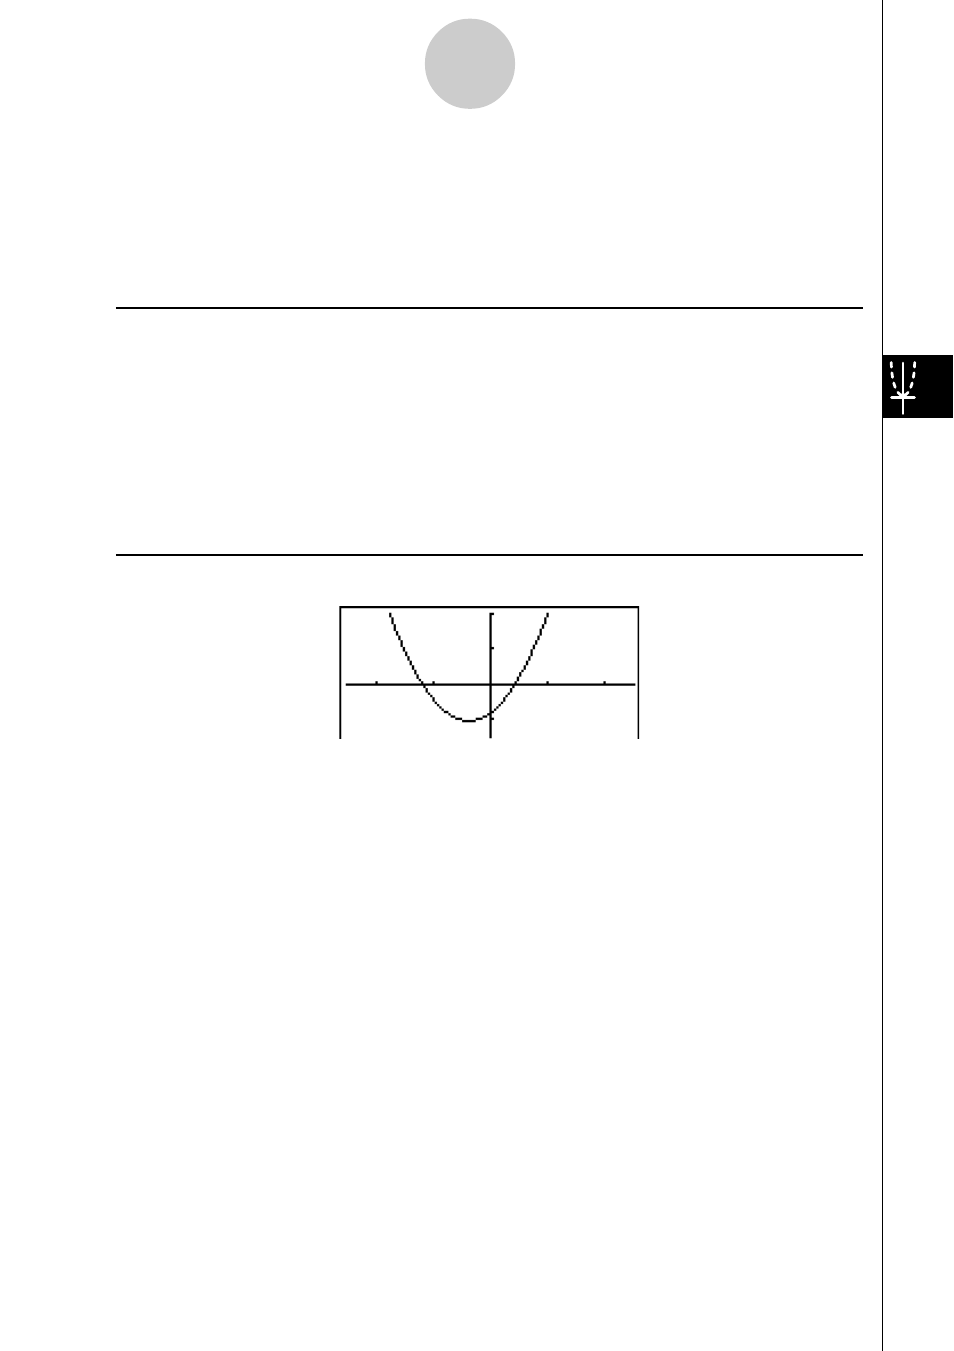
Représentation graphique manuelle
○ ○ ○ ○ ○
Exemple
Représentez graphiquement
y
= 2
x
2
+ 3
x
– 4
Utilisez les réglages de fenêtre d’affichage suivants.
Xmin = – 5,
Xmax = 5,
Xscale = 2
Ymin = –10,
Ymax = 10,
Yscale = 5
Procédure
1
m RUN
•
MAT
2
!3(V-WIN) -fwfwcwc
-bawbawfwJ
3
!4(SKTCH)1(Cls)w
5(GRPH)1(Y=)
4 c
vx+dv-ew
Ecran de résultat
Advertising
Ce manuel est liée aux produits suivants: