Casio GRAPH 85 Manuel d'utilisation
Page 203
Advertising
20050301
○ ○ ○ ○ ○
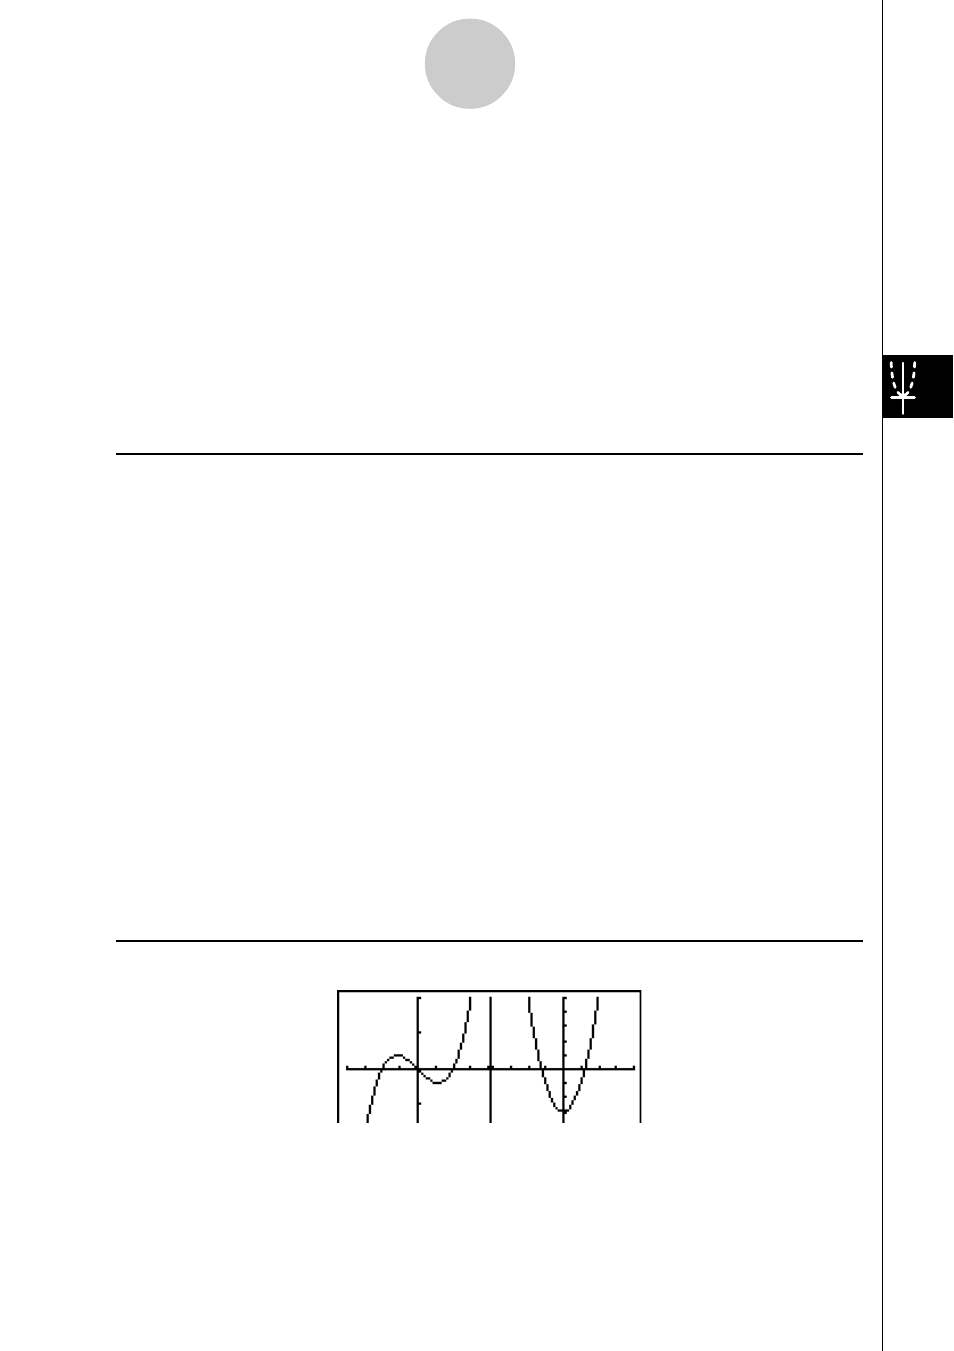
Exemple
Représenter graphiquement
y
=
x
(
x
+ 1)(
x
– 1) sur l’écran principal et
y
= 2
x
2
– 3 sur l’écran secondaire.
Utilisez les réglages de fenêtre d’affichage suivants.
(Ecran principal)
Xmin = –4,
Xmax = 4,
Xscale = 1
Ymin = –5,
Ymax = 5,
Yscale = 1
(Ecran secondaire)
Xmin = –2,
Xmax = 2,
Xscale = 0.5
Ymin = –2,
Ymax = 2,
Yscale = 1
Procédure
1
m GRAPH
2
!m(SET UP)cc1(G+G)J
3
!3(V-WIN) -ewewbwc
-fwfwbw
6(RIGHT) -cwcwa.fwc
-cwcwbwJ
4
3(TYPE)1(Y=)v(v+b)(v-b)w
c
vx-dw
5 ff1(SEL)
6
6(DRAW)
7
K2(SWAP)
8
A
9
1(SEL)
0
6(DRAW)
Ecran de résultat
5-5-4
Tracé de deux graphes sur le même écran
Advertising
Ce manuel est liée aux produits suivants: